Hi, I’m Chris Walton, author of this guide and CEO of Eton Venture Services.
I’ve spent much of my career working as a corporate transactional lawyer at Gunderson Dettmer, becoming an expert in tax law & venture financing. Since starting Eton, I’ve completed thousands of business valuations for companies of all sizes.
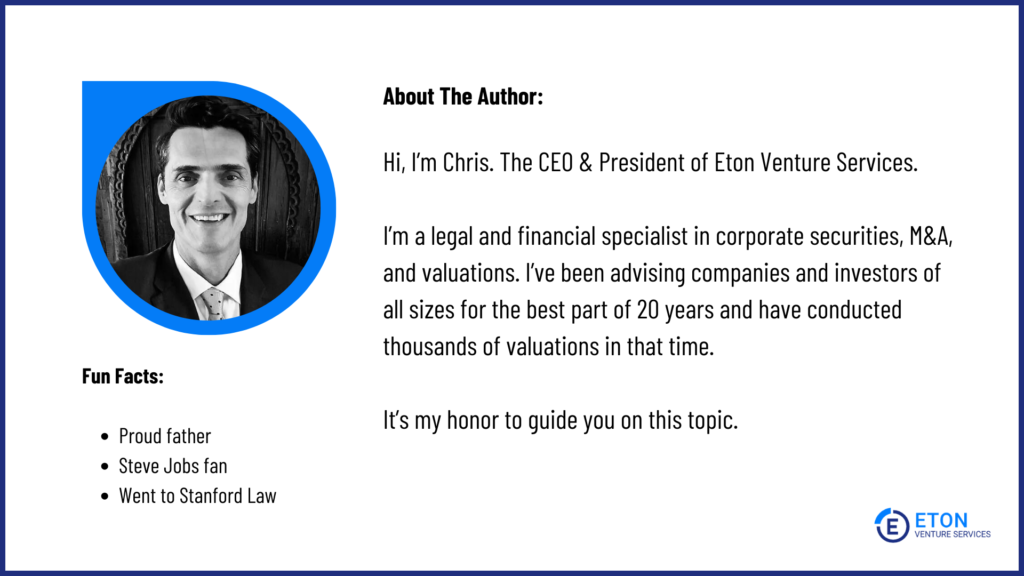
Read my full bio here.
In 2006, Google stunned the tech world when it acquired YouTube for $1.65 billion.
On paper, the numbers didn’t add up; YouTube was a young video-sharing site with very little tangible assets, hemorrhaging money and facing an uncertain future.
But Google saw something others missed: the intangible value of YouTube’s vast network of content creators and its passionate audience. At a $455 billion valuation today, they were right. It wasn’t just a platform; it was a community with the potential to revolutionize how the world consumed video.
This acquisition is a textbook example of how the true value of a business isn’t always in what you can see or measure easily. It’s often hidden in the brand, the community, and the partnerships that drive its future growth.
In this article, we’ll explore why valuing these assets is essential, the five key intangible asset valuation methods, and how to choose the right approach for your business.
Key Takeaways
|
Intangible asset valuation is the process of figuring out the value of non-physical assets of a business.
Non-physical assets considered intangible include (full definition here):
You can’t physically touch these assets, unlike tangible assets such as buildings and machinery.
Nevertheless, they are very important for a company’s long-term success.
They help a company:
90% of company value today in the S&P 500 is driven by intangible assets.
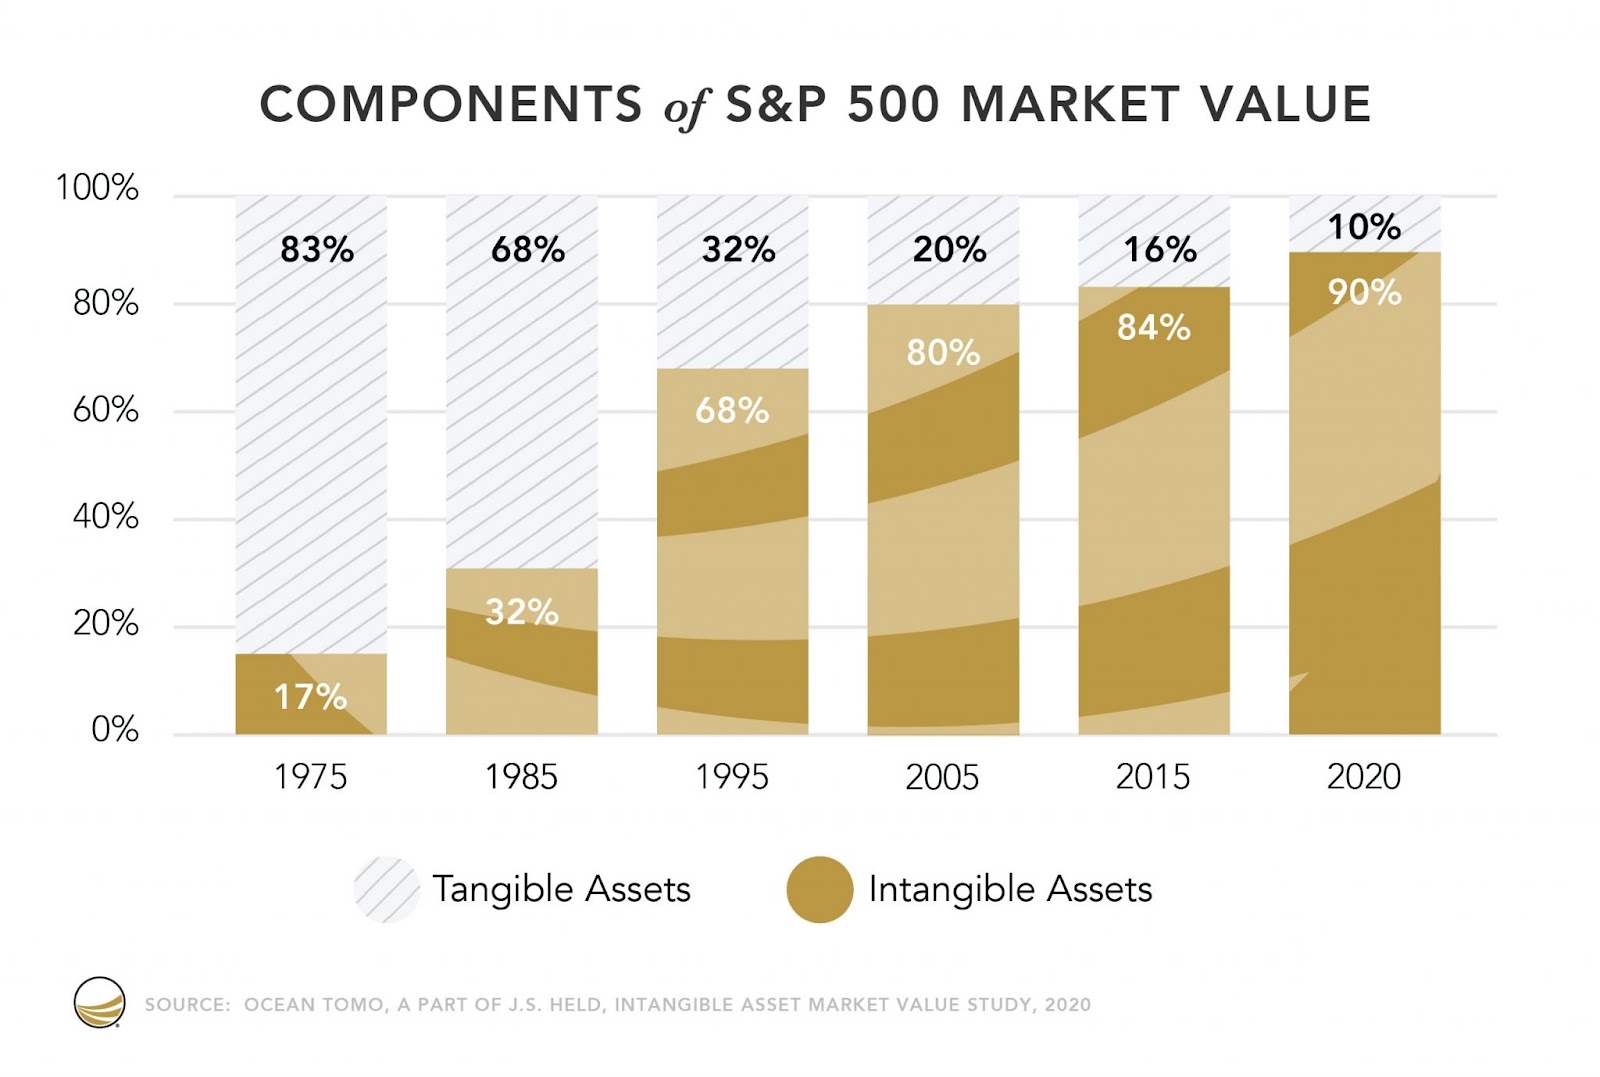
Globally, the value of intangible assets is US$61.9 trillion.
In startups, these assets are even more critical, often making up the bulk of their value.
“The quality of intangible assets a start-up is generating via its research and development processes is a critical indicator for investors of future value, given the inherent lack of track record early-stage businesses have,” says CEO Paul Adams of EverEdge Global, an intangible asset advisory.
He gives an example from the company, Instagram.
When Facebook bought Instagram, the company was 20 months old and had:
Valuing tangible assets alone would suggest Instagram was worth close to $0, but Facebook paid $1 billion.
That’s because Facebook bought Instagram not for its employees or office equipment, but for its the intangible assets:
Hence, these things, while not hard financial metrics have clear value and must be accounted and argued for when valuing a business. Here’s exactly why:
Typically, to calculate the total value of a company’s intangible assets, subtract its book value (assets minus liabilities) from its market value (total value as determined by the stock market or a buyer’s valuation).
However, for specific intangible assets like patents or trademarks, we typically use five valuation methods:
Each approach has its strengths, and combining them often provides a more well-rounded valuation. Here’s how they work:
The Relief from Royalty Method (RRM) is commonly used to value trademarks, domain names, licensed software, and in-progress R&D that directly contribute to revenue. It estimates how much a company saves in royalties by owning the asset instead of licensing it.
This method combines two valuation approaches:
For example, if a company would have paid $500,000 annually in royalties to use a trademark but avoids this cost by owning the trademark, the method calculates the present value of those savings over the asset’s useful life (let’s assume 10 years). If the total discounted savings amount to $1.33 million, then that is the value of the trademark.
Here’s how the process works in detail, with a trademark as our example:
Step 1: Forecast Revenue from Products/Services Using the Intangible Asset
Look at historical data, expected growth rates, and market conditions. Then estimate the revenue generated by products and services that utilize the intangible asset over its useful life.
Suppose a trademark allows a company’s products & services to be marketed at a premium price and creates additional customer loyalty. You can project the revenues of those product sales and attribute that revenue to the trademark.
For our example, let’s imagine products using a trademark are projected to generate a steady $10M in annual revenue over its useful life.
Step 2: Determine a Notional Royalty Rate
A notional royalty rate is the percentage of revenue a company would pay to use an asset if it didn’t own it.
Determine this rate to estimate the cost savings from owning the asset rather than licensing it. To do this, look at market data such as comparable licensing agreements (you can often find these in old court agreements or industry databases).
Let’s assume that in our example, we find that licensing agreements for comparable trademarks indicate a royalty rate of 5%.
This means that if the company didn’t own the trademark, it would likely pay 5% of its revenue to license it. We use this rate in the next steps to calculate the asset’s value.
Step 3: Calculate Gross Royalty Savings
Gross royalty savings represent the estimated cost a company avoids by owning an asset instead of licensing it. This helps quantify the financial benefit of ownership.
To calculate gross royalty savings, we apply the notional royalty rate (determined in Step 2) to the projected revenue (from Step 1) for each year of the asset’s useful life.
For example, if the projected annual revenue is $10 million and the royalty rate is 5%, the gross royalty savings would be $500,000 per year ($10 million × 5%). This figure serves as the foundation for further valuation adjustments in the next steps.
Apply the notional royalty rate to the projected revenue (from step 1) for each year of the asset’s useful life to calculate gross royalty savings.
Using our example, $10 million in annual revenue multiplied by the 5% royalty rate results in $500,000 in gross royalty savings per year.
Step 4: Apply the Tax Rate
After-tax savings represent the actual financial benefit a company keeps after accounting for taxes. Since royalty payments are usually tax-deductible, we must adjust the gross royalty savings to reflect the tax impact.
To do this, we apply the corporate tax rate to the gross royalty savings calculated in Step 3.
Let’s say the corporate tax rate is 30%. The after-tax savings are calculated as $500,000 × (1 – 0.30), resulting in $350,000 per year.
Step 5: Discount the After-Tax Royalty Savings
Calculate the present value of the after-tax savings by applying a discount rate that reflects the time value of money and risk.
In this case, we’ll use a discount rate of 10%. The present value for each year’s after-tax savings is as follows:
Step 7: Sum the Discounted Savings
Add the present value of the after-tax royalty savings for all years to calculate the total value of the intangible asset.
For our example: $318,182 + $289,256 + $263,869 + $239,881 + $218,073 = $1,329,261.
In this scenario, the total value of the trademark is $1,329,261. This represents the economic benefit the company gains by owning the asset instead of licensing it.
The With-and-Without Method (WWM) is commonly used to value intangible assets like non-compete agreements.
It estimates the value of the asset by comparing two scenarios: one where the asset is in place (the “with” scenario) and one without it (the “without” scenario).
The difference between these scenarios is calculated using a discounted cash flow model. It represents the value of the intangible asset.
Here’s a step-by-step guide to the process:
Step 1: Gather Projections for Both Scenarios
Start by estimating the business’s financial performance under two scenarios: one with the intangible asset in place (the “With Scenario”) and one without it (the “Without Scenario”).
For example, with a non-compete agreement, the business might expect $20 million in annual revenue, while without it, competition could reduce revenue to $15 million.
Step 2: Calculate Free Cash Flows for Each Scenario
To calculate future free cash flows, subtract operating expenses and necessary reinvestments from projected revenue. This ensures you’re capturing the actual cash available for the business in each scenario.
In this example, the FCF might be $5 million per year with the agreement and $3 million per year without it.
Step 3: Discount the Future Free Cash Flows to Their Present Value
To reflect the time value of money, discount the future cash flows for both scenarios to their present value using a discount rate. Let’s use a 10% discount rate over five years.
After summing the discounted cash flows, the total present value for the “With Scenario” would be $18,953,935, and for the “Without Scenario,” it is $11,372,361.
Step 4: Calculate the Difference
Subtract the total discounted cash flows for the “Without Scenario” from the “With Scenario.” This difference represents the value of the intangible asset.
In this case: $18,953,935 – $11,372,361 = $7,581,574
Step 5: Adjust for Probability (If Needed)
If there’s uncertainty about the likelihood of competition or other factors impacting cash flows, adjust the value based on probability.
For example, if there’s a 70% chance of significant competition, the adjusted value would be $7,581,574 × 70% = $5,307,102.
Step 6: Add the Tax Amortization Benefit (TAB)
Include the tax savings from amortizing the asset’s value over time. For instance, if the asset value is $7,581,574 and is amortized over 15 years, with a 30% tax rate, the annual tax savings would be approximately $151,631.
Discount these savings to their present value and add the total TAB to the calculated value of the intangible asset.
The value of the intangible asset is the discounted cash flow difference between the two scenarios, adjusted for probability and tax savings.
The Multi-Period Excess Earnings Method (MPEEM) is a variation of the discounted cash flow (DCF) method, used when a single intangible asset, such as software or customer relationships, is the primary driver of a business’s value.
It’s particularly relevant for technology companies, startups, or firms where specific assets generate a significant portion of revenue.
The MPEEM isolates the cash flows attributable to the intangible asset and calculates its fair value by discounting those cash flows to their present value.
Here’s how the MPEEM method is applied in practice:
Step 1: Project the Business’s Future Performance
Start by projecting the company’s financial performance over the useful life of the intangible asset. This involves estimating revenue, expenses, and other financial needs like working capital and capital expenditures. The goal is to establish the overall cash flows of the business.
Step 2: Subtract Contributory Asset Charges (CACs)
Contributory Asset Charges (CACs) are charges for assets that work together with the primary intangible to generate revenue.
For example, when valuing customer relationships, part of the cash flows must be allocated to the office space and computer equipment needed to service those customers.
After identifying these necessary supporting assets, subtract their charges to isolate the earnings attributable to the primary intangible asset being valued.
Step 3: Calculate the Present Value of the Intangible Asset’s Cash Flows
The earnings remaining after deducting CACs are the “excess earnings” directly tied to the intangible asset.
To then determine the asset’s fair value, apply a discount rate that reflects risks and the time value of money. This converts the excess earnings into their present value, providing a clear measure of the intangible asset’s contribution to the business.
Some intangible assets, like undeveloped patents or natural resource options, don’t generate cash flows today but may hold significant future potential.
These assets often have option characteristics, giving the owner the right but not the obligation to take action, such as developing or selling the asset, at a later time.
This flexibility makes real option pricing, which borrows concepts from financial options, an effective method for their valuation.
Real option pricing focuses on an asset’s time value—the idea that its worth might grow as uncertainties are resolved or conditions improve.
For instance, an asset with a net present value (NPV) of zero or negative today could still hold value due to its potential for future cash flows.
This makes the method particularly useful for intangible assets where timing and flexibility play a key role, such as patents or R&D projects.
Here’s a step-by-step guide to how real option pricing values such assets:
Step 1: Define Key Variables
Start by identifying and calculating the main factors that influence the value of the real option:
Step 2: Select the Appropriate Option Pricing Model
The Black-Scholes Model is a straightforward option for simpler cases where the inputs are clear and well-defined.
For more complex scenarios, such as when decisions need to be evaluated step by step over time, the Binomial Tree Model offers greater flexibility and precision.
Step 3: Perform the Calculation
Use the selected model to calculate the option’s value.
This calculation incorporates the key variables and provides the estimated time value of the asset, even when its current NPV is zero or negative. It shows how waiting or taking specific actions in the future might unlock the asset’s potential.
Step 4: Interpret the Results
Compare the calculated option value to the exercise cost (the investment needed to develop or commercialize the asset):
The Replacement Cost Method, a cost-based valuation approach, is ideal for valuing intangible assets like software, databases, or proprietary systems.
It estimates the cost a market participant would need to pay to recreate the asset’s utility using modern, cost-effective materials and techniques. The focus here is on the asset’s functionality rather than its physical properties.
Here’s how it works:
Step 1: Calculate Replacement Cost
Start by estimating the total cost that a typical market participant would incur to create a modern equivalent asset.
This refers to an asset that provides the same function and utility as the original but is designed and constructed using current, cost-efficient techniques and materials.
The goal is to reflect what it would cost to replicate the utility of the asset today, not its exact physical specifications.
Step 2: Adjust for Obsolescence
Evaluate the asset for obsolescence, which reduces its value compared to the theoretical cost of a new replacement. This includes:
Another type of obsolescence is physical obsolescence, which refers to the loss of value due to wear and tear or degradation. However, it’s not relevant in the case of intangible assets.
Step 3: Deduct Obsolescence from Replacement Cost
Subtract the total depreciation caused by obsolescence from the calculated replacement cost.
This adjustment ensures the final value reflects the asset’s true current utility in its present condition and market environment.
Common challenges in valuing intangible assets include a lack of standardized accounting practices, the absence of active markets, and subjectivity in assumptions.
Here’s a breakdown of each and how to address them:
Accounting standards like IAS 38 and ASC 350 allow companies to record intangible assets on the balance sheet only if they are identifiable (can be separated and sold or transferred) and acquired externally (purchased).
In contrast, most internally developed intangibles, such as brand value or intellectual property, are excluded from the balance sheet. This is because it is difficult to reliably measure their value or directly link development costs to future economic benefits.
As a result, businesses may not fully capture the true worth of their intangible assets, leading to potential undervaluation.
To improve transparency:
This helps stakeholders better understand the intangible value, even if accounting rules don’t allow these assets to appear on the balance sheet.
Unlike stocks or real estate, which have well-established markets where buyers and sellers can easily determine prices, intangible assets often lack a vibrant marketplace. This makes it difficult to find comparable transactions or benchmark prices for valuation purposes.
So, instead of relying on market-based approaches:
However, note that these methods involve significant subjective assumptions about future cash flows, discount rates, and useful life estimates, which require expertise to assess accurately.
Valuing intangible assets often involves significant subjectivity, as many factors require judgment rather than objective measurement.
For instance, selecting appropriate royalty rates or estimating the remaining useful life of an asset depends on assumptions about future performance, market conditions, and comparable data. These judgments can vary widely and directly influence valuation outcomes.
To reduce subjectivity:
For example, adjusting the expected useful life from 10 years to 5 or 15 years shows how the valuation changes.
This method helps companies understand the potential range of outcomes and the level of uncertainty, providing clearer insights for decision-making when valuing intangible assets.
Given these challenges, working with experienced valuation professionals becomes particularly valuable. Their expertise helps companies apply the right methodologies and document their reasoning effectively—whether for financial reporting, transactions, or strategic planning.
At Eton, we bring over 20 years of experience in providing expert-led, defensible valuations across all asset types, including intangibles.
Our team offers customized, end-to-end support, trusted by startups, venture firms, and high-net-worth individuals for reliable insights in even the most complex valuation scenarios.
Contact us today to learn more about how we can help.
Understanding the future trends in intangible assets can help you stay competitive and drive growth.
Increased Investments in Intangibles
Top companies spend a lot more on intangible assets than companies that don’t perform as well.
A recent survey showed that the best-growing companies, which are in the top 25% for economic growth, invest 2.6 times more in intangibles than the companies in the bottom 50%.
So, we can expect companies to keep investing more in intangible assets in the future.
Importance of Cybersecurity
As data and software become more important, companies will need to invest more in strong cybersecurity and data privacy to protect these assets from online threats.
ESG Focus
Managing digital assets uses a lot of energy, especially in data centers.
As companies use more cloud computing and big data, their energy consumption rises. Data centers need constant power for servers and cooling systems.
Growing focus on environmental, social, and governance (ESG) factors is influencing how companies manage and talk about their intangible assets, with greater emphasis on sustainability and ethical practices.
According to the report “Approaching the Future 2023: Trends in Reputation and Intangible Asset Management,” integrating ESG criteria into business strategies is now the most relevant aspect for organizations in terms of intangible asset management.
Intangible Assets Made Accessible by AI
Rapid advancements in technology, like artificial intelligence and machine learning, are making the creation and management of intangible assets more accessible.
Companies using these new technologies can find new ways to create value, make their asset management easier, and improve decision-making with data.
Yes, intangible assets can lose their value in several ways.
In these cases, the company must adjust the value of the asset on the balance sheet and may recognize a loss in the income statement.
Intangible assets appear as non-current assets on the balance sheet and amortize over time, except for assets with indefinite lives like goodwill, which companies test for impairment each year.
Amortization reduces both the asset’s value on the balance sheet and the company’s net income on the income statement. Similarly, when a company identifies an impairment, it writes down the asset’s value and recognizes the loss as an expense, which also affects net income.
Not always. While intangible assets can contribute to a company’s future earnings, their value can also decline due to factors like market changes, business performance, or legal challenges, potentially lowering the company’s overall valuation.
Schedule a free consultation meeting to discuss your valuation needs.
Chris Walton, JD, is President and CEO and co-founded Eton Venture Services in 2010 to provide mission-critical valuations to private companies. He leads a team that collaborates closely with each client’s leadership, board of directors, internal / external counsel, and independent auditors to develop detailed financial models and create accurate, audit-ready valuations.