Hi, I’m Chris Walton, author of this guide and CEO of Eton Venture Services.
I’ve spent much of my career working as a corporate transactional lawyer at Gunderson Dettmer, becoming an expert in tax law & venture financing. Since starting Eton, I’ve completed thousands of business valuations for companies of all sizes.

Read my full bio here.
Arguably the cornerstone of financial due diligence, Quality of Earnings (QoE) cuts through the noise to uncover the true story behind revenue numbers.
With extensive experience conducting M&A due diligence, we’ve seen firsthand how this clarity can be the key to avoiding post-closing disputes and ensuring a successful transaction.
So, if you’re approaching a merger or acquisition, read on to discover how analysts conduct a QoE analysis and why it’s necessary for securing a deal built on solid financial ground.
Key Takeaways
|
In a business sale, a Quality of Earnings (QoE) report clarifies if the earnings the seller reported reflect the company’s actual performance. It does this by assessing whether these earnings are sustainable and tied to core operations or influenced by temporary factors.
The process is carried out by an independent third party after the letter of intent is signed. Based on their analysis, earnings are classified as either ‘high-quality’ or ‘low-quality’:
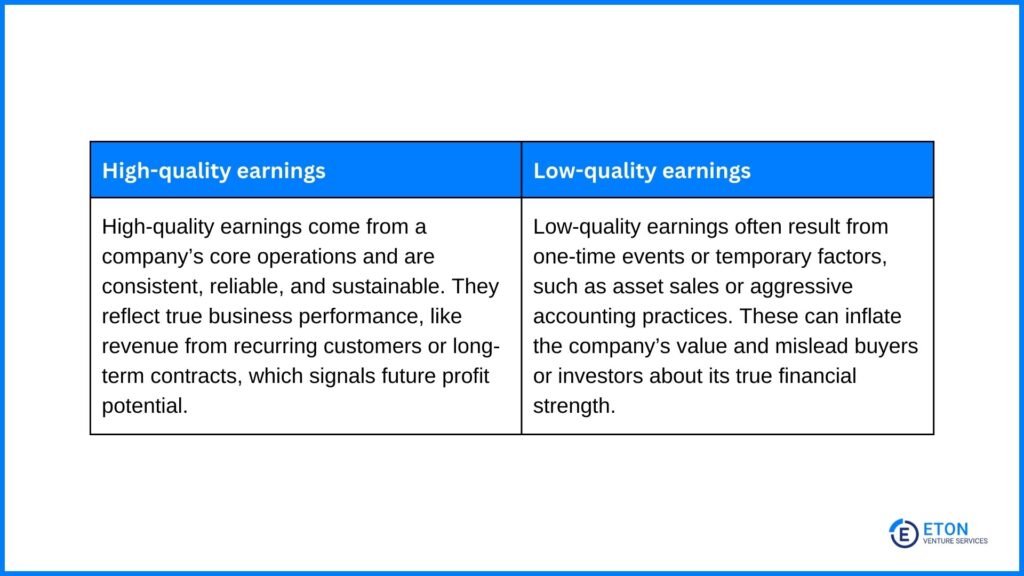
This classification is important because earnings are often used to calculate EBITDA (Earnings Before Interest, Taxes, Depreciation, and Amortization), a key metric in business valuations.
A QoE analysis adjusts reported EBITDA to exclude non-recurring or misleading factors, ensuring it reflects the company’s true operational performance.
This adjustment and classification of earnings in a QoE report offers several advantages.
For both parties, thorough financial due diligence reports strengthen trust, offer an independent perspective, and minimize post-closing disputes—ultimately increasing the likelihood of a successful deal.
If you’re preparing for buy-side due diligence, a QoE analysis conducted by our financial experts at Eton can provide the clarity and confidence needed to make informed investment decisions.
Contact us to ensure your next deal is built on a solid foundation of reliable financial insights.
To calculate the QoE ratio, which quantifies the “quality” of a company’s earnings:

For example, if a company reports $1.5 million in net cash from operating activities and $2 million in net income, the QoE ratio would be 0.75.
Interpreting the QoE Ratio:
In our example, the QoE ratio of 0.75 highlights that the company’s reported earnings aren’t fully supported by cash flow, a potential red flag during due diligence.
To learn about this in more depth, we recommend reading our complete guide to performing QoE ratio analysis.
The purpose of a Quality of Earnings Report is to provide a comprehensive document that highlights the reliability, consistency, and long-term viability of a company’s earnings.
Here’s how the process works:
Before diving into financial data, you need to understand the bigger picture of the company and its industry. This ensures you evaluate financial trends and anomalies in the right context. Focus on:
The goal of this step is to compile a comprehensive dataset that provides a clear picture of the business’s historical and current performance.
To do this, the deal team collects and organizes all necessary financial and operational data.
Required documents include:
To set the stage for the next phase of the analysis—adjusting the financial statements, ensure the financial data is both accurate and reliable.
Work with an analyst on a preliminary review to:
Any discrepancies they identify during this phase go to the management team for discussion, where the analyst probes deeper to understand the root causes.
They frame these discussions from the perspective of a potential buyer, that way, the analysis aligns with the transaction’s objectives.
And if team members give conflicting answers, the analyst will repeat questioning to clarify and reconcile the issues.
Standardize and clean the financial data to gain a clearer picture of the company’s true earning power.
In this process, the deal team adjusts the financial statements by identifying both recurring and non-recurring adjustments.
Non-recurring adjustments focus on removing one-time income and expenses that are unlikely to repeat in the future. This ensures the financial statements accurately reflect the business’s core operational performance.
Examples of non-recurring adjustments include:
On the other hand, recurring adjustments are made to normalize financial data and ensure it reflects the company’s ongoing operational performance.
Examples of recurring adjustments include:
To identify these adjustments, the deal team should:
It’s important to carefully document all adjustments, including their rationale and supporting data. This ensures transparency and reliability in the analysis.
Conduct a thorough analysis of the company’s financial and operational performance. The goal is to assess the reliability of the business’s operations and its ability to maintain or grow profitability.
This involves examining the business holistically to identify trends, risks, and opportunities that may impact the sustainability of its earnings. Here’s what you do:
To help you understand what these elements entail and how they fit into the QoE report, we’ll walk you through the key components of the report in the next section.
This includes detailed assessments of income statements, balance sheets, cash flow, and operational performance.
The final step is compiling the findings into a comprehensive QoE report.
The deal team delivers the finished product as a PDF or a detailed spreadsheet, often containing dozens of tabs to walk the reader through the analysis.
A Quality of Earnings report typically contains five key components: an executive summary, income statement analysis, balance sheet analysis, cash flow statement analysis, and operational analysis.
In this section, we’ll walk you through what each entails so you can understand the insights they provide.
Please note that the images are provided as examples and do not reflect the full report.
The Executive Summary offers a high-level overview of the business, summarizing key details like the company’s location, history, and management structure.
It outlines the scope of the transaction, including whether it involves an asset or stock purchase and the proposed purchase price.
This section sets the stage for the analysis by highlighting key findings, any critical financial or operational insights from the report, and significant tax-related risks identified during the review.
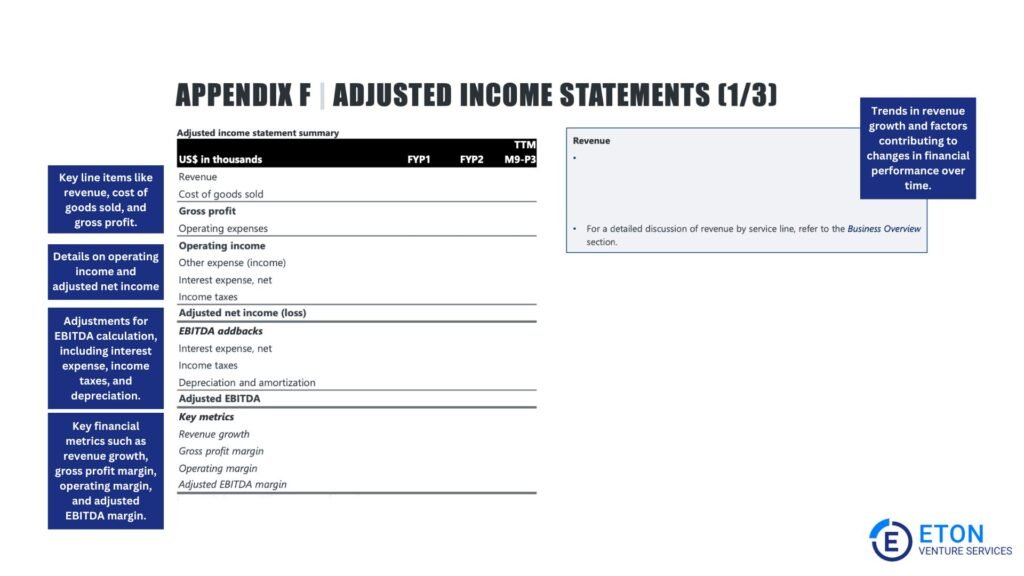
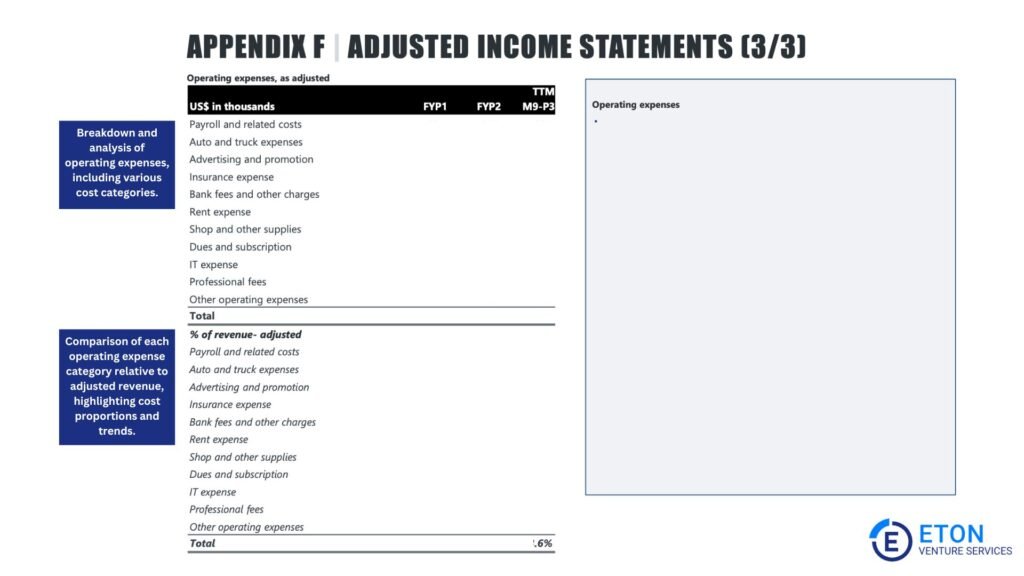
The income statement analysis reviews the company’s revenue, margins, and expenses to assess its financial performance and operational efficiency.
It confirms that revenue aligns with operations and identifies unusual or non-recurring expenses that could affect profitability. This includes:
Revenue recognition ensures that income is reported accurately and per GAAP standards.
This means you should only recognize revenue when goods or services are delivered, and the customer has accepted them.
Additionally, the analyst must carefully review contract terms, long-term agreements, discounts, returns, or deferred revenue to ensure revenue reflects the company’s financial position without distortions.
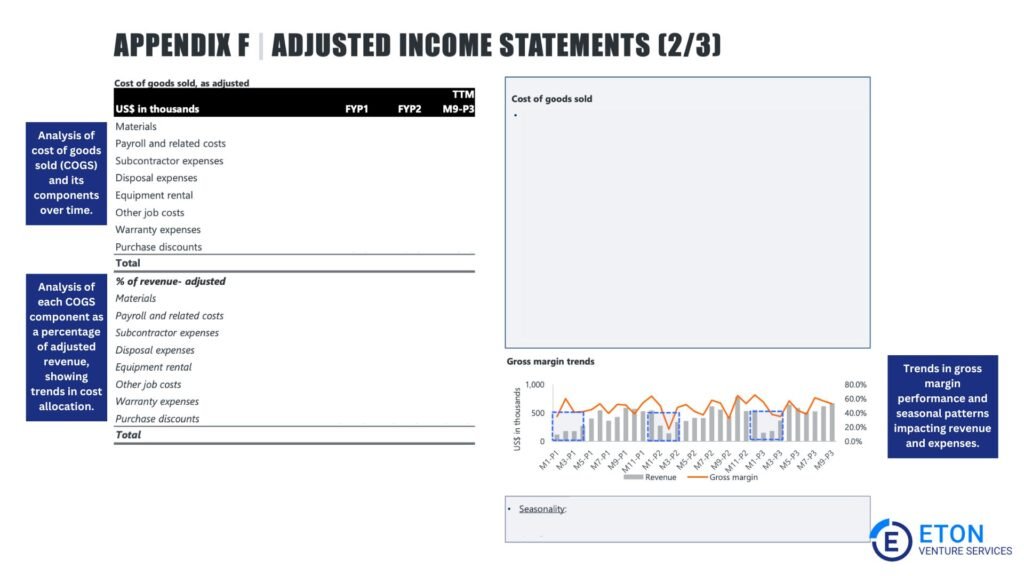
The deal team analyzes gross margins to assess profitability trends and operational efficiency.
For example, higher gross margins than competitors’ may reflect effective cost management or pricing strategies.
On the other hand, declining margins might signal operational inefficiencies or market challenges.
The team normalizes earnings by excluding non-recurring or owner-specific expenses, such as personal use of company assets or one-time legal fees.
They also make recurring adjustments to account for ongoing operational costs or revenues, such as depreciation, amortization, or operating leases. This provides a more accurate reflection of sustainable performance.
Additionally, they may apply pro forma adjustments to reflect expected post-transaction changes, such as cost efficiencies or improvements in how the business operates.
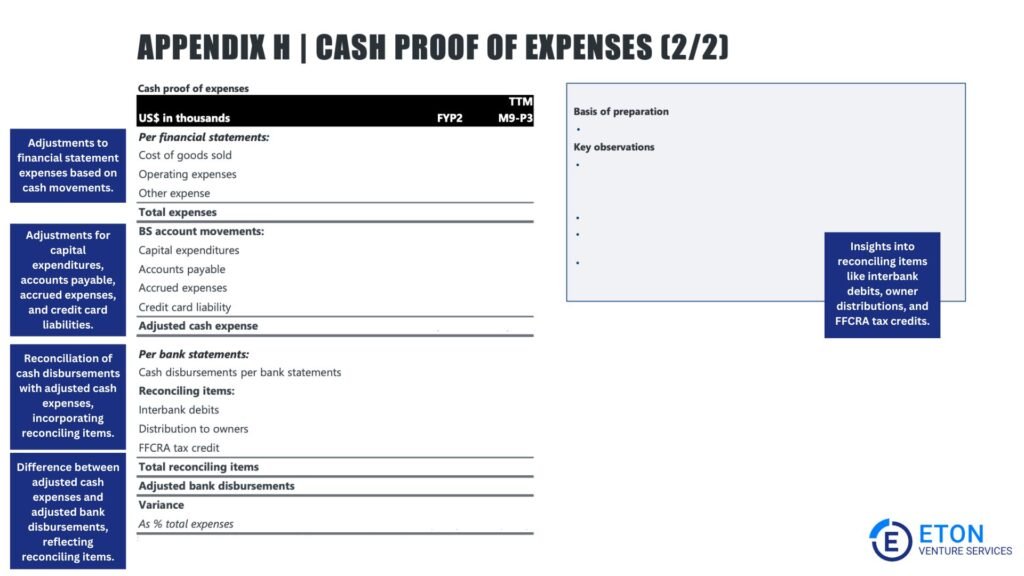
Analysts review costs thoroughly to ensure they are accurately recorded and aligned with the corresponding revenue.
This involves checking that expenses are categorized correctly (operating vs. non-operating) and recognized in the correct periods.
Proper expense management helps to identify inefficiencies, potential cost-cutting opportunities, and risks, such as inflated or deferred expenses that may distort profitability.
Adjustments may include correcting the timing of bonuses, aligning tax-related revenue recognition, or adjusting bad debt reserves.
These ensure the company’s tax positions aligns with its actual operations and help identify risks from aggressive tax practices or underreported income.
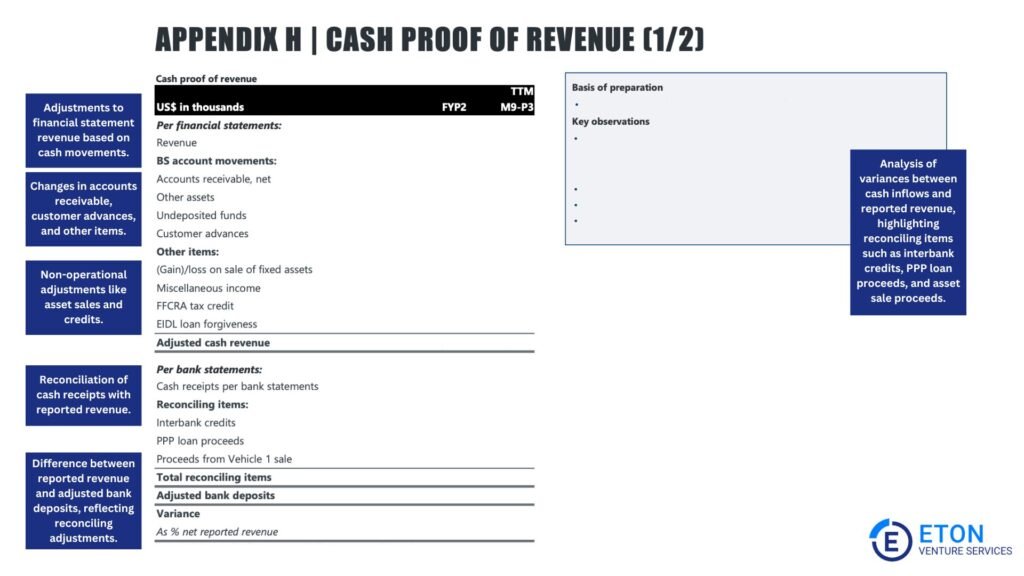
A cash flow assessment evaluates whether a company’s cash flow is accurate and sustainable.
This is important for assessing the business’s ability to meet its financial obligations, reinvest in operations, and maintain long-term financial stability. Key elements include:
This step involves verifying reported revenue by cross-referencing income figures with underlying documentation, such as contracts, invoices, and bank statements.
Any discrepancies or irregularities the team identifies, they investigate to ensure that revenue is legitimate and accurately reported.
This process reconciles bank statements with the company’s financial records to confirm that cash flow figures match actual transactions.
It ensures the accuracy of liquidity reporting and provides a reliable picture of the company’s financial health and cash management practices.
Analysts calculate free cash flow by determining the cash available after covering operational expenses, taxes, and asset investments. Unlike EBITDA, it reflects the actual cash available for reinvestment, debt repayment, or distributions to stakeholders.
Free cash flow offers a clearer picture of the company’s ability to fund operations, invest in growth initiatives, and meet financial obligations without relying on external financing.
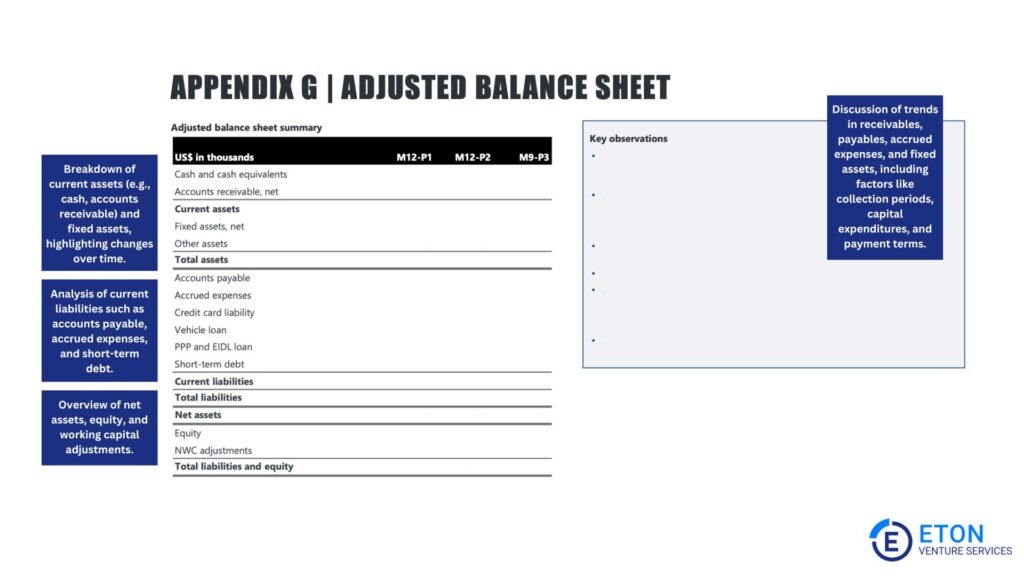
The balance sheet analysis ensures that the income statement and cash flow results align with the company’s assets, liabilities, and equity. This helps identify discrepancies or inconsistencies in how the company reports or interprets financial data. It includes:
This examines working capital, the difference between current assets (such as cash and receivables) and current liabilities (like payables and short-term debts).
The analysis assesses whether the company has enough liquidity to meet short-term obligations and maintain smooth operations without financial strain.
The deal team may make adjustments to reflect accurate working capital calculations based on seasonal or non-recurring fluctuations.
Identifying discrepancies in working capital management can highlight inefficiencies in cash flow or credit management, which are key operational risks.
The team identifies all financial obligations, including loans, leases, and contingent liabilities (e.g., lawsuits or fines) to help buyers understand the company’s debt exposure.
They review tax liabilities for unpaid or underreported taxes that may impact the transaction or future operations.
Identifying discrepancies in liabilities reveals risks related to unaddressed debt or regulatory issues, which can affect the company’s daily operations.
Related-party analysis reviews transactions between the company and affiliated entities, such as related businesses or family-owned suppliers.
The focus is on ensuring these dealings are conducted at market rates—“arm’s length”—to maintain the accuracy of the company’s financials.
It also identifies risks tied to these relationships, such as dependencies on key customers or suppliers, which could be affected by changes in ownership.
Discrepancies in how the company records or discloses these related-party transactions can point to underlying risks of operational instability or conflicts of interest.
Operational analysis evaluates the company’s ability to sustain and grow its earnings through efficient operations. This includes:
This examines the company’s reliance on key suppliers and customers.
High dependency on a small group of suppliers or customers introduces risks if these relationships change, potentially impacting revenue and operational continuity.
This evaluates employee turnover, compensation structures, and retention strategies to identify risks stemming from workforce instability.
High turnover or inadequate retention plans can disrupt business operations and impact long-term growth.
The deal team reviews the condition of tangible assets like machinery and inventory alongside projected capital expenditures (CapEx).
This analysis helps gauge the company’s ability to sustain or expand operations without interruptions due to aging assets or insufficient investment in growth.
A QoE analysis is quite an extensive process. Proper preparation on both the buyer and seller side is necessary to ensure it runs efficiently and that the findings are accurate and useful.
For sellers, this means:
For buyers, this means:
In short, collaboration between both parties and the QoE team is key to a successful process.
With proper preparation, sellers can present their business in the best possible light, and buyers can gain the confidence to make informed decisions—setting the stage for a smooth and successful transaction.
At Eton, we deliver precise, in-depth buy-side Quality of Earnings analyses that reveal the true financial performance of your target company.
Our experts work closely with you to provide clarity on sustainable earnings, uncover hidden risks, and equip you with the information you need to make confident, well-informed decisions.
Whether you’re securing financing, negotiating terms, or planning post-deal strategies, our meticulous approach ensures that every aspect of your transaction is built on a foundation of reliable insights.
Join the many clients who have trusted Eton Venture Services to guide them through the most critical financial aspects of their M&A journeys. Contact us today to learn how we can help you achieve your goals with confidence and expertise.
A typical engagement on a quality of earnings analysis lasts four to eight weeks.
The exact timeline can vary depending on the complexity of the business, the scope of the analysis, and the availability of financial records.
A Quality of Earnings Report for small businesses with less than $10 million in revenue typically costs between $25,000 and $35,000. For larger businesses, prices often start at $60,000 and can reach six figures.
Costs depend on several factors, including:
While costs vary, investing in a thorough QoE report from a trusted firm is required to avoid costly mistakes during a transaction.
If significant red flags are uncovered—such as inflated earnings, hidden liabilities, or inconsistencies in reporting—buyers may renegotiate terms, adjust the purchase price, or, in extreme cases, walk away from the deal.
Sellers, on the other hand, can use the findings to address issues proactively, disclose them transparently, or prepare for renegotiations.
An audit provides assurance that a company’s financial statements comply with GAAP, focusing on reported financial results, accuracy, and compliance.
It typically examines annual results and emphasizes net income, with detailed testing of account balances and transactions. Audits are primarily used for regulatory or compliance purposes.
A QoE report, however, is specifically designed for M&A transactions.
It analyzes and normalizes historical results by removing non-recurring, unusual, or one-time items, and focuses on adjusted earnings such as EBITDA.
QoE reports typically cover a longer time period, including monthly results, and focus on business risks, adjusted working capital, and indebtedness—key factors for buyers in a transaction.
In essence, audits verify financial accuracy, while QoEs provide the insights necessary to assess the sustainability of earnings and evaluate risks in the context of M&A.
Buyers in M&A deals almost always rely on a QoE as part of due diligence and rarely depend solely on an audit.
Schedule a free consultation meeting to discuss your valuation needs.
Chris Walton, JD, is is President and CEO and co-founded Eton Venture Services in 2010 to provide mission-critical valuations to private companies. He leads a team that collaborates closely with each client’s leadership, board of directors, internal / external counsel, and independent auditors to develop detailed financial models and create accurate, audit-ready valuations.